

|
|
|
Focus! | |
|
| |
|
| |
|
Think Tank Enterprises, Inc. specializes in innovative graphical representations of complex data.
Data visualization solutions are developed to be simple, intuitive, informative and attractive.
Based on a combination of available features in Microsoft Excel and VBA code we generate high impact
data visualizations that clearly communicate your most important analysis results to the stakeholders that need it the most.
| |
 | |
|
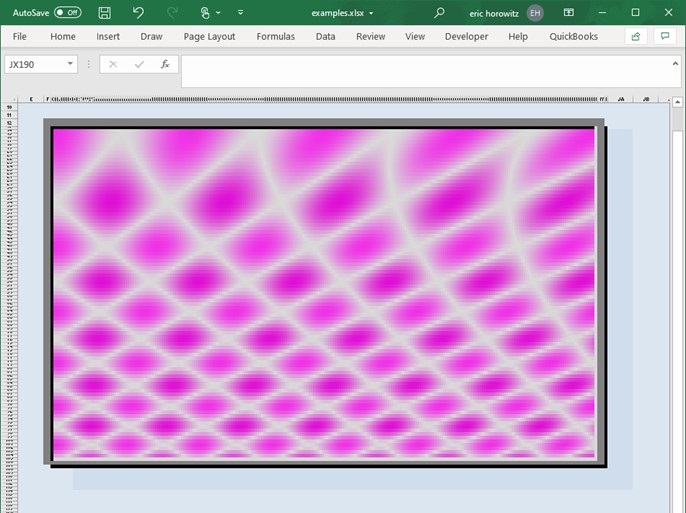
This example shows the interference pattern of two competing signals. It can be used to demonstrate the complex nature of how multiple waves interact. | |

|
|
| © 2020, Think Tank Enterprises, Inc., All Rights Reserved. | 20200617 |